SEAM Outputs
Coverage Check
A coverage check is a process in SEAM that allows the cross-referencing of elements found in the System Architecture Model, the Functional Decomposition Model, and the GSN Assurance Model of a specific system. During the coverage check, the goals, strategies, and solutions in GSN assurance arguments are related to the functional model and the system model. This process is particularly useful for complex systems where the assurance argument needs to account for a myriad of components, as well as for their functional inter-dependences and propagated failures.
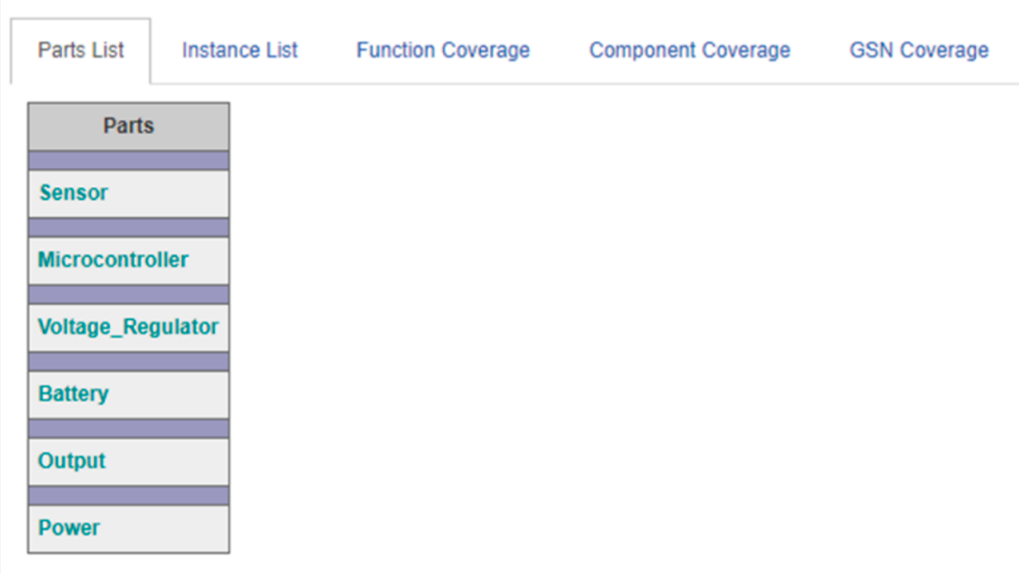
Figure IX. 1. Coverage check for the parts list. Each row corresponds to a part model in the parts library
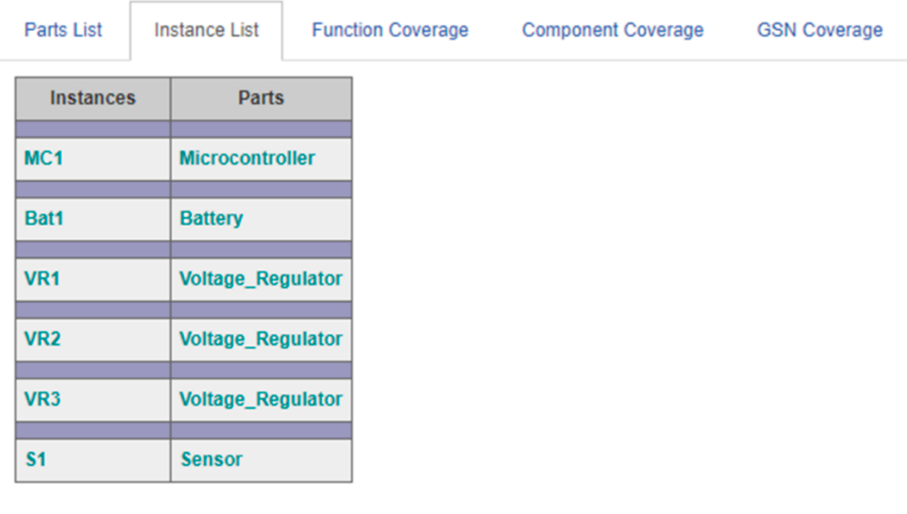
Figure IX. 2. Coverage check for the instance list. Each row corresponds to a component instance in the system model and its associated part in the part library
Each coverage check consists of a parts list, an instance list, a function coverage, a component coverage, and a GSN coverage. The parts list (Figure IX. 1) is a table of part type models associated with the current system model. Each part type model also serves as a hyperlink that allows the user to navigate to the part model and its internal fault model.
The instance list (Figure IX. 2) is a table presenting all component instances in the system’s architecture model. For each row, the component instance shows the corresponding part from the part library.
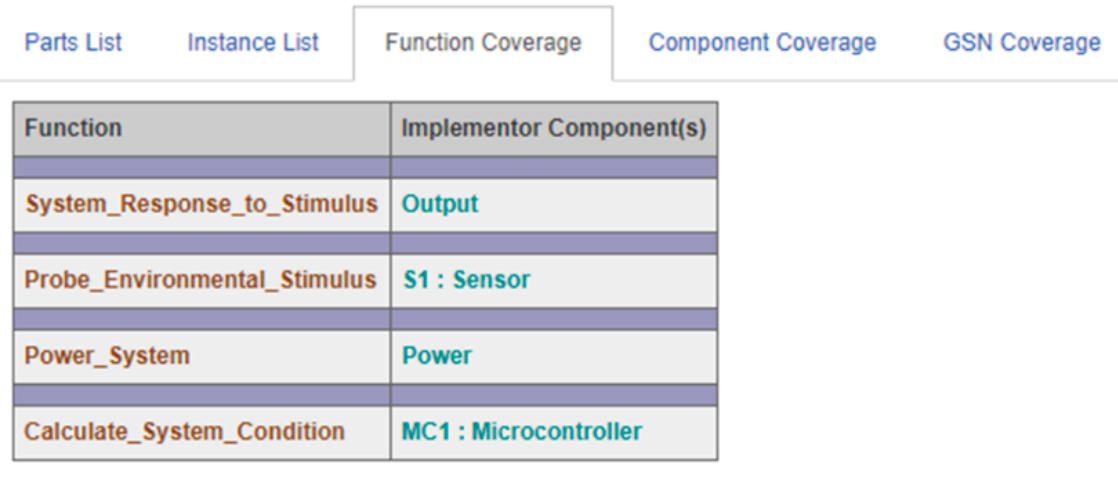
Figure IX. 3. Coverage check for the function coverage. Each row corresponds to a function in the function decomposition model and the component (part) in the system design that implements the function.
The function coverage list (Figure IX. 3) is a table providing a summary of the functional decomposition model. For each row, the function lists the component(s) implemented in the system model. This table allows functions that lack a corresponding implementation component in the system to be flagged. A function that lacks a corresponding implementation component informs the user that either the functionality is not implemented, or the relationships have not been captured in the functional decomposition model.2
The component coverage list maps component instances in the system model to the appropriate function(s) in the functional decomposition model. It is likely that component instances of the same part support different functions in the system. Entries that are not related to any function are appropriately flagged.2
The GSN coverage (Figure IX. 4) list presents a table detailing the coverage of assurance arguments in the GSN model relative to the components in the system. It also lists the GSN goals and solutions for the assurance argument related to each component instance in the system. It further identifies the specific GSN goals related to each of the underlying component faults, each functional degradation effect of the propagating fault, and each mitigation strategy associated with the fault propagation.2
Overall, Figure IX. 4 shows an example GSN coverage table generated as part of the coverage check. The first column corresponds to the component instance; the next column corresponds to any fault originating from within the component; this is followed by the effect (E) and the mitigation response (R) related to the fault propagation. The links to the GSN arguments are listed in the next column. Entries with no associated GSN arguments are flagged with a red question mark (“?”) symbol.
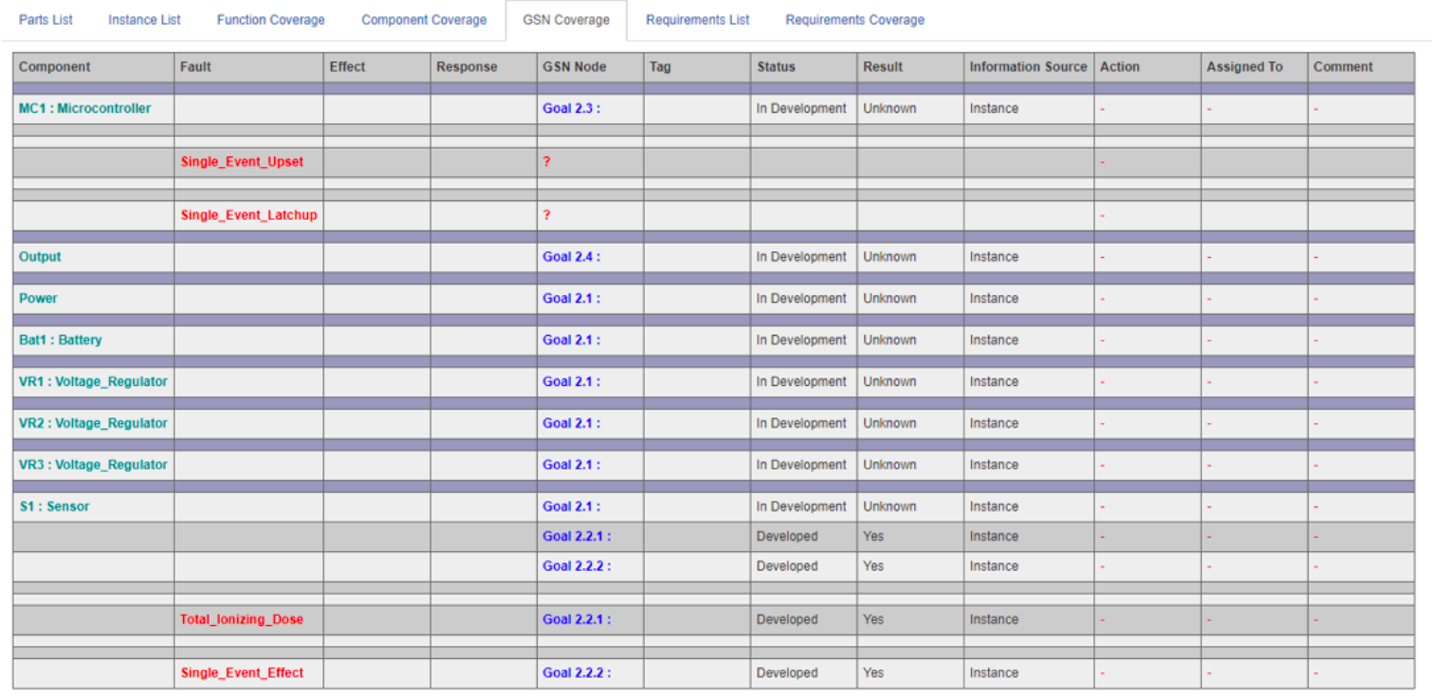
Figure IX. 4. Coverage check for GSN coverage. The table maps the parts in the system design and their underlying faults to the GSN arguments (goals/solutions).
The next few columns reveal the status of the specific GSN goal (Developed/ In-development), and the result of the argument based on if it meets the specifications or not (yes/ no/ partial). “Information Source” indicates if the argument pertains to the specific component instance or the part it corresponds to. Action column reveals the user decision on the completion status of the argument (completed/needs attention/ ignore). The penultimate column allows for traceability and assignment of individual arguments to persons. The comments column keeps a record of the comments related to the decisions made pertaining to the arguments.3
Creating a Coverage Check
Before creating a coverage check, the user first begins with a GSN model (Figure IX. 5).
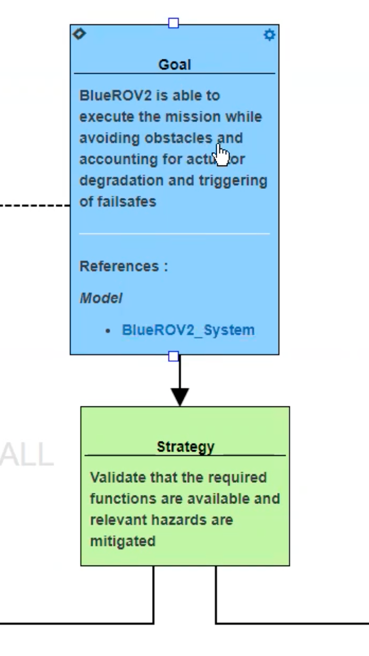
Figure IX. 5. Example of a GSN Model
Connected to the GSN model should be a functional decomposition model (Figure IX. 6).
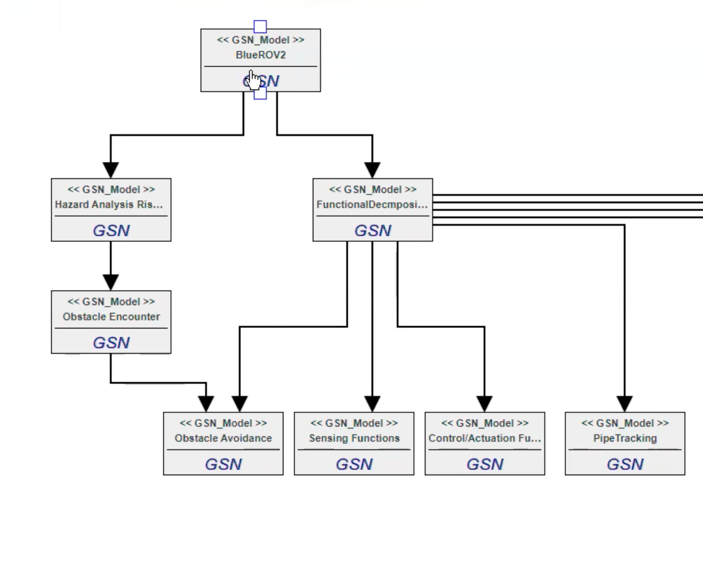
Figure IX.6. Example of a Functional Decomposition Model
Clicking the top function will lead into a list of potential attributes for the functional decomposition model that can have their targets adjusted (Figure IX. 7).
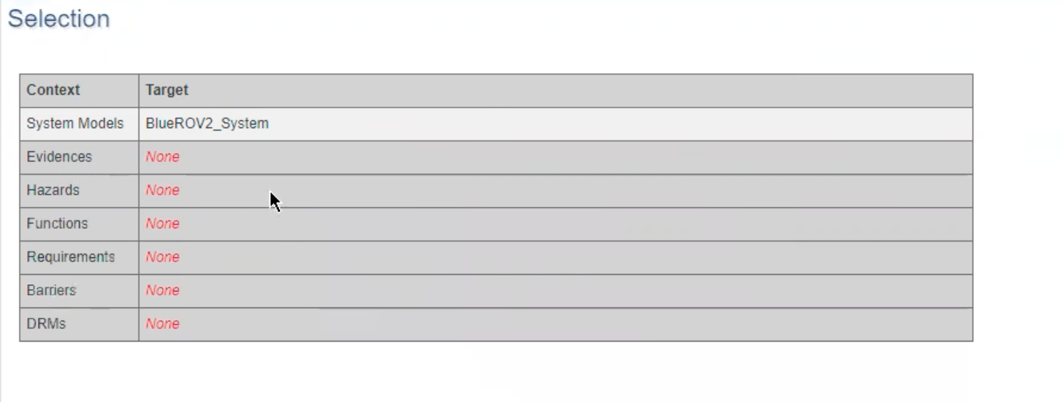
Figure IX.7. Context Selection Drop Down List
Clicking the ‘System Models’ context row brings the user to a new drop-down list where the ‘Target’ of the ‘Context’ can be altered (Figure IX. 8).
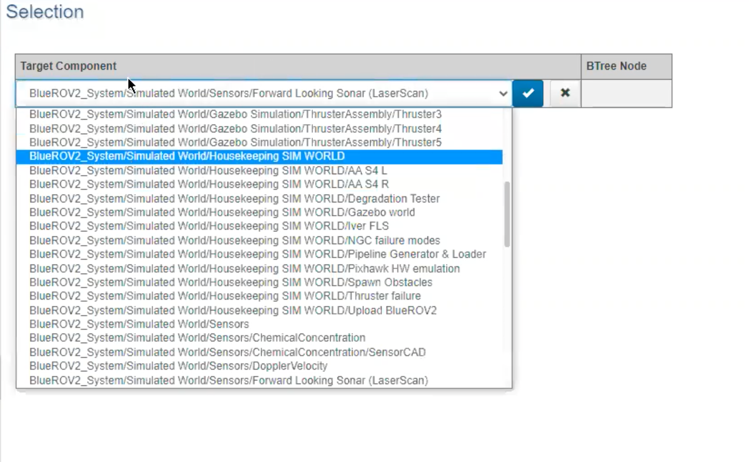
Figure IX.8. Target Selection Drop Down List
Fault Trees
Fault trees are graphical models that represent how low-level events, like component faults, combine and propagate to high-level events (like system-wide failures). The combination of the low–level events is expressed using an AND/OR tree-like structure. The extraction of fault trees, as well as other reliability artifacts, from SysML has been demonstrated as viable means of rapidly building reliability models.
In this tree (Figure IX. 9), primary events are the leaves, intermediate nodes are either logical combinators (disjunctive or conjunctive) or intermediate (e.g., sub-system level) events, and the top (root) node of the tree is the system level event. The arrows connecting the nodes (from leaves towards the root) indicate causation or enablement. The AND/OR operators operate on probabilities of events assigned by the modeler. Fault-trees allow not only the review and logical analysis of how local faults combine and lead to system-level events, but also the calculation of the probability of those events as a function of the probabilities of the low-level events. Thus, they are very useful tools for evaluating the reliability of the system, and in design. For the latter, when the designer changes the system (e.g., by introducing redundancy), the fault tree can help the quantitative evaluation of how the reliability improves (or degrades).
Figure IX. 9 Fault Tree generated by SEAM based on the functional decomposition model, system model and the underlying fault propagation model. Boxes represent top-event or intermediate event in the fault tree. Boxes with a circle below represent the basic event. Loss of Function (LF) events are in blue, Loss of component (LC) events are in brown and Failure mode events are in red. Triangle represents the loss of mitigation function.
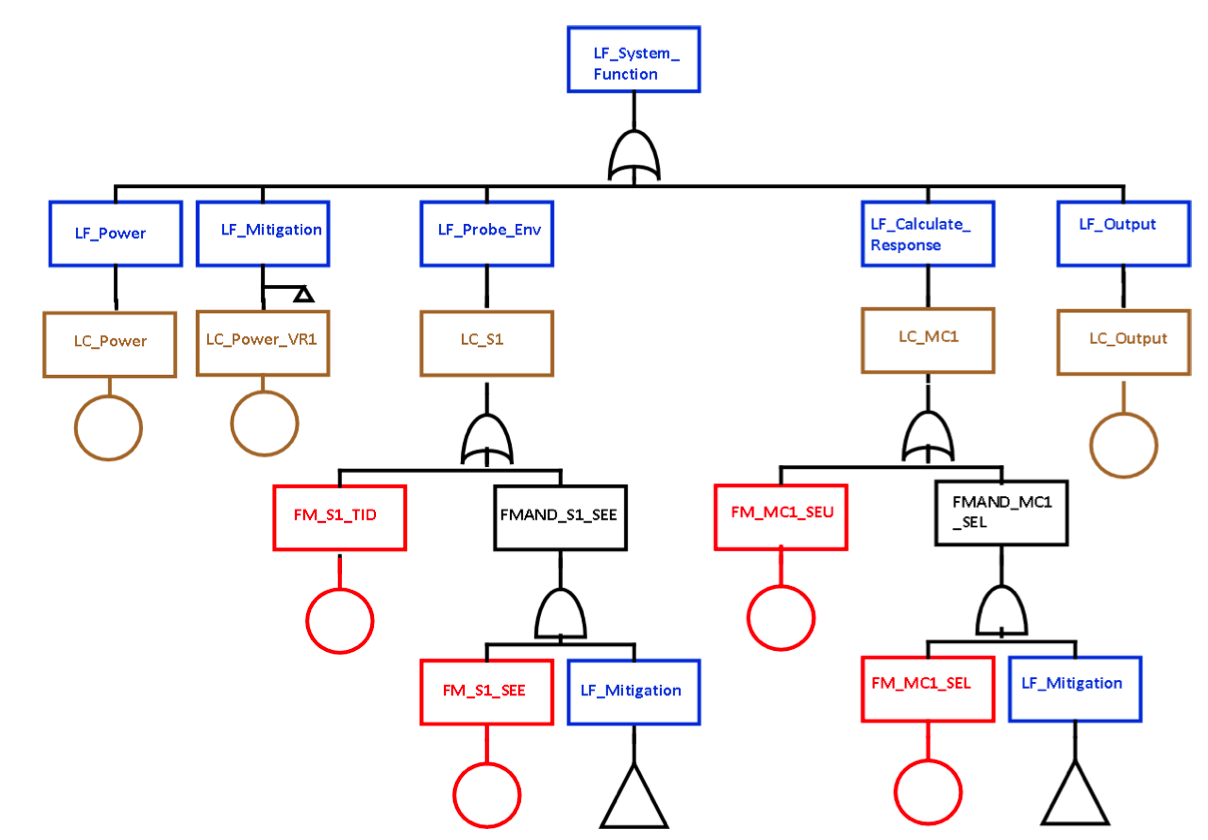
Figure IX.9. Fault Tree generated by SEAM based on the functional decomposition model, system model and the underlying fault propagation model. Boxes represent top-event or intermediate event in the fault tree. Boxes with a circle below represent the basic event. Loss of Function (LF) events are in blue, Loss of component (LC) events are in brown and Failure mode events are in red. Triangle represents the loss of mitigation function.
References
- K. L. Ryder et al., “SYSTEMS ENGINEERING AND ASSURANCE MODELING (SEAM): A WEB-BASED SOLUTION FOR INTEGRATED MISSION ASSURANCE,” Facta Universitatis, Series: Electronics and Energetics, vol. 34, no. 1, Art. no. 1, Feb. 2021.